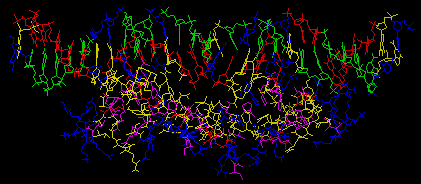
FIGURE 7
Interactive molecular models of the GR DBD/GRE complex. To view these molecules use the RASMOL progam (Macs, windows or unix machines supported).
Using the "Colors" menu, select the "User" color scheme. This will color code the residues as in all previous figures.
P>

A. The GR DBD/GRE complex prior to energy minimization and molecular dynamics.
Click on the image to download the interactive molecule.

B. The GR DBD/GRE complex after energy minimization, heating, equilibration and
600 picoseconds of molecular dynamics.
Click on the image to download the interactive molecule.