FIGURE 3
(a) A computer model of the Glucocorticoid Receptor (GR) DBD from NMR structural determination in complex with a 17 base-pair nucleotide sequence containing the Glucocorticoid Response Element (GRE) left and right DNA major groove half sites in an 80 Angstrom diameter water droplet prior to energy minimization and molecular dynamics calculations. The DNA nucleotides and amino acids are colored as in figure2. Water molecules are colored light blue- green. All of the 24,792 atoms in the complex are shown. (b) A computer model of the GR DBD with an exon 5 encoded predicted alpha helix attached in complex with a 29 base-pair DNA sequence containing the GRE and flanking regions in a 10 Angstrom water layer prior to energy minimization and molecular dynamics calculations.
(c) A computer model of the GR DBD/ 17 bp GRE complex after energy minimization, heating, equilibration and 30 picoseconds of molecular dynamics is shown. White dotted lines represent Hydrogen bonds. In this model, only the water molecules which mediate protein/DNA hydrogen bonds at some point during the entire simulation are displayed. (d) A computer model of the GR DBD/29 bp GRE complex after energy minimization, heating, equilibration and 300 picoseconds of molecular dynamics is shown. In this model, only the water molecules which mediate protein/DNA hydrogen bonds at some point during the entire simulation are displayed.
(e) A computer model of the GR DBD/ 17 bp GRE complex with the protein docked at about 10 angstroms from the DNA in order to clearly see the DNA conformation. ( f) A computer model of the GR DBD/29 bp GRE complex with the protein docked at about 10 angstroms from the DNA in order to clearly see the DNA conformation.
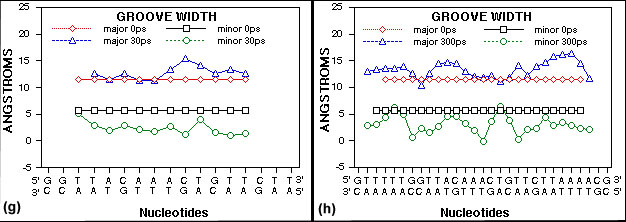
(g) A plot of groove width for the 17 bp GRE DNA is shown. Groove parameters were calculated using
the CURVES program from R. Lavery (22). Major and
minor DNA groove width data from 0 picoseconds and 30 picoseconds of molecular dynamics
simulation are shown.
(h) A plot of DNA
groove width for the 29 bp GRE and flanking nucleotide DNA is shown. Groove parameters were
calculated using the CURVES program from R. Lavery (22). Major and minor DNA groove width
data from 0 picoseconds and 300 picoseconds of molecular dynamics simulation are shown.